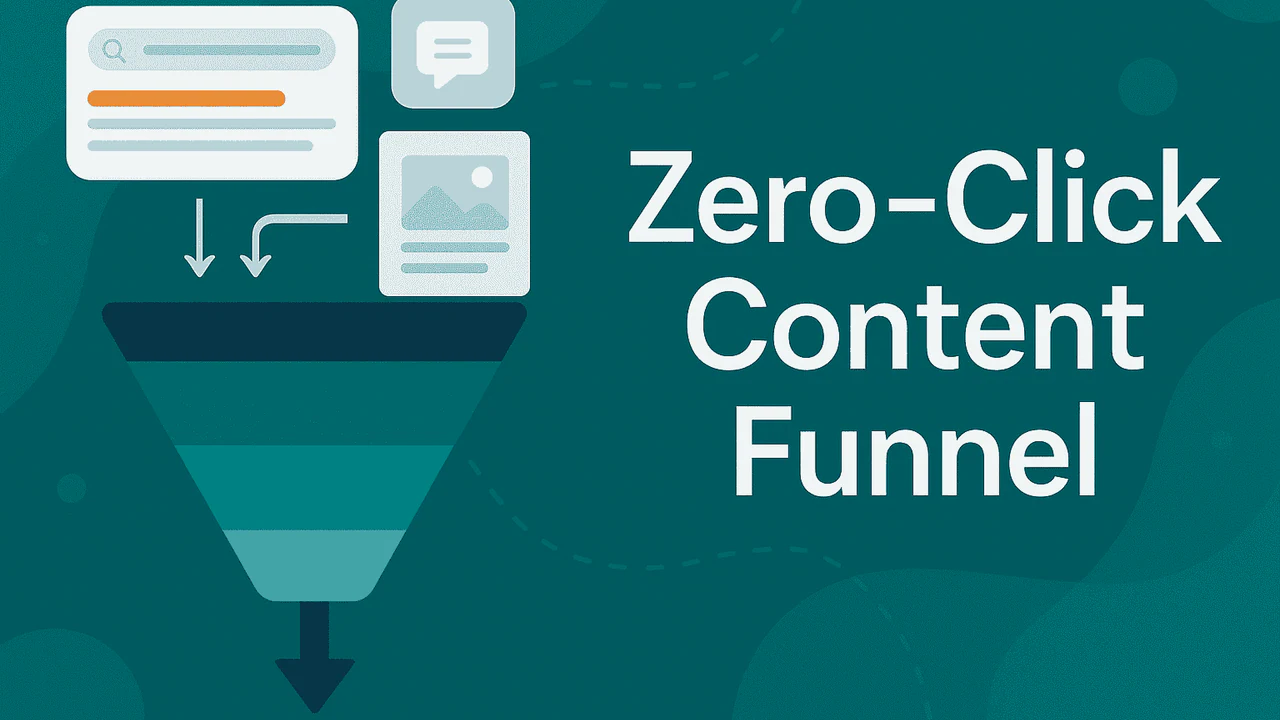

Clicks no longer tell the full story.
The web shifted quietly at first, Featured Snippets and People Also Ask boxes started answering questions before users could even scroll. That was phase one. Now, AI Overviews, ChatGPT summaries, and Perplexity-style answers are rewriting the rules entirely.
Search is no longer an access point. It’s an endpoint.
The same is happening across social. LinkedIn, Instagram, and Facebook now punish outbound links in feed posts. Native content is rewarded. Traffic is penalized. In fact, over 97% of top-performing Facebook posts contain no external link (source), because platforms want users to stay, not bounce.
Marketers who keep optimizing for click-through rate are tracking a metric that’s quietly dying.
But zero-click doesn’t mean zero value. You can measure success, just not in the way you used to.
This guide covers:
- The metrics that matter when traffic doesn’t happen.
- How to track brand exposure inside social feeds and AI models.
- What KPIs indicate performance when users never visit your site.
- The tools and tracking logic behind attribution in a zero-click funnel.
What Is Zero‑Click Success And Why Are New Metrics Needed?
Zero-click success describes marketing impact that happens without driving traffic to your website. Instead, performance is measured by visibility, engagement, and conversions inside platforms like Google AI, LinkedIn, or TikTok.
Where over 65% of Google searches end without a click (SparkToro), success must be tracked differently, focusing on attention, trust, and algorithm signals rather than site sessions.
Clicks are no longer the default outcome.
Search engines, social platforms, and AI interfaces now deliver value without requiring a single user to leave the page, or even think about your website.
That’s not failure. That’s zero-click success, and it’s changing everything marketers know about performance measurement.
What Counts as Zero‑Click Success?
Zero-click success is visibility and action that happens natively, without leaving the host platform. These interactions show brand authority and influence even though they don’t show up in analytics dashboards.
- AI answers without a visit (why it matters: credibility): Your brand is cited in ChatGPT, Perplexity, or Google Gemini (formerly Bard), giving you authority without a site visit.
- In-feed social reach (why it matters: engagement depth): A LinkedIn carousel generates 500+ saves, shares, and comments without a click, showing clear resonance.
- Branded exposure in snippets (why it matters: recall): Dominating People Also Ask or Knowledge Panels keeps your brand top-of-mind.
- Native lead form completions (why it matters: frictionless conversion): TikTok Instant Pages or LinkedIn Lead Gen Forms capture emails instantly without redirect.
This is a new type of visibility, distributed, in-platform, and native-first.
Why Traditional Analytics No Longer Fit
Traditional tools like GA4 were designed for traffic-based measurement. But when the best-performing content never leaves the feed or SERP, clicks and sessions no longer reflect reality. If you rely only on site metrics, you’ll miss most of your marketing impact.
You’ll miss:
- The reach of LinkedIn posts that never link out.
- Brand mentions picked up by AI models.
- Top-of-funnel impact from search results without clicks.
If you only measure what happens on your site, you’ll miss most of your success.
A New KPI Mindset
Zero-click success isn’t about traffic. It’s about attention, recall, and algorithm visibility.
To track that, marketers now need to:
- Use platform-native metrics (dwell time, shares, saves).
- Monitor AI citation presence.
- Track branded search spikes and direct traffic lift.
- Capture self-reported attribution in forms and sales calls.
This is where the funnel lives now, in-platform, pre-click, and often invisible to your dashboard unless you know where to look.
Why Traditional Metrics No Longer Tell the Full Story
The click was never the goal, the attention was.
But for years, marketers measured success with a simple formula: more clicks = more impact. That no longer works.
Today, zero-click content does its job inside the feed, the SERP, or the AI answer box, without driving traffic at all.
The Decline of Traffic-Based KPIs
- Click-through rate is tanking: Users increasingly get what they need without leaving the platform.
- Bounce rate is misleading: A one-page session doesn’t mean failure if that one page lives on LinkedIn or TikTok.
- Session-based metrics distort performance: You can’t measure what never lands on your site in the first place.
Visibility Without the Visit
Zero-click visibility is happening everywhere:
- Your LinkedIn post gets 1,200 impressions, 40 saves, and sparks a conversation. No click, but strong brand equity.
- Your tool is cited by Perplexity or Bard as a solution. No link, but massive top-of-funnel trust.
- Your how-to infographic is screenshotted and shared in Slack threads. No UTM tag, but viral exposure.
This is real performance, even if your analytics platform can’t see it.
The Blind Spots of Legacy Analytics
Google Analytics 4 wasn’t built for in-platform performance. If it doesn’t touch your site, it doesn’t get logged.
That creates three major blind spots:
- Zero-click search placements (AI Overviews, snippets, PAA)
- Social-native visibility (carousels, Reels, short-form posts)
- AI assistant citations (ChatGPT, Claude, Gemini)
You’re getting reach, you’re just not seeing it.
Dark Social Makes It Worse
Even when users do click, you won’t always know where they came from. Sharing in:
- Slack channels
- Messenger DMs
- Email forwards
…all strip referral data. That means ‘direct traffic’ now includes a huge chunk of your most valuable word-of-mouth exposure.
One study showed 84% of consumer sharing happens via dark social.
If you’re only measuring clicks, bounce, and sessions, you’re not measuring marketing, you’re measuring pageviews.
In 2025, content lives where users already are. Measurement must shift with it.
What Are the Right Metrics for Measuring Zero‑Click Content?
Legacy analytics tools weren’t built for a world where performance happens off your website.
Clicks, sessions, and bounce rate don’t mean much when your best-performing content never leaves LinkedIn, TikTok, or an AI assistant’s response box.
Measuring zero-click success means changing from click-based tracking to visibility, engagement, and in-platform conversion metrics that actually reflect reach and intent.
Platform Visibility & Awareness Metrics
How to measure reach without traffic.
This is where visibility happens, whether or not it lands on your domain.
- Impressions & reach: Baseline for how many people saw the content inside the platform.
- Follower/subscriber growth: Audience expansion over time, not just short-term traffic.
- Feed dwell: Time users spend on the post, even without interaction.
- Branded search lift: More people Googling your name = content recall.
- Direct traffic spikes: When users navigate to your site manually after platform exposure.
- AI citations: Your brand or content referenced by ChatGPT, Perplexity, or Google Overviews, these are the new high-authority backlinks.
Tools to track: LinkedIn analytics, TikTok/YouTube Insights, Google Search Console (brand queries), Perplexity/ChatGPT mentions.
Engagement Signals That Fuel Algorithms
Metrics that show content quality inside social feeds.
Algorithms reward what users engage with deeply.
- Engagement rate: Ratio of likes, comments, and shares to impressions.
- Saves/bookmarks: One of the strongest intent signals.
- Rewatches (video): Indicates relevance and value, especially on TikTok and YouTube Shorts.
- Comments & reply threads: Depth of discussion = signal of authority.
- Profile taps/clicks: Users seeking more from your account.
These signals drive amplification, even if no one clicks out.
In-Platform Conversion Metrics
When conversion happens inside the ecosystem.
Clicks still matter, but only when they’re native to the platform.
- Lead-gen form completions: Meta, TikTok, and LinkedIn offer in-feed forms with high conversion rates.
- Instant page CTR: TikTok Instant Pages and YouTube Forms keep users on-site while driving action.
- Tap-to-DM or Tap-to-Text: One-click opt-ins through Instagram or Facebook.
- CTA clicks (inside carousels or captions): Non-link CTAs that drive comment or DM responses.
These conversions are trackable, fast, and often outperform site redirects.
Funnel Velocity & Content Impact Over Time
Measuring influence even when clicks are delayed.
Sometimes, the click comes later, but the content did the work upfront.
- Time-to-convert: How long between platform engagement and opt-in/purchase.
- Multi-touch exposure: How often someone sees your content before converting.
- Self-reported attribution: ‘How did you hear about us?’ questions reveal zero-click influence.
- Dark social monitoring: Shares in Slack, WhatsApp, or email that don’t show in analytics, but often start from a feed post.
Funnel measurement in 2025 requires blending quantity and quality.
Traditional vs. Zero-Click Metrics: What to Track Now
| Legacy Metric | Why It Fails Today | Zero-Click Alternative | Why It Matters |
|---|---|---|---|
| Click-through rate | Ignores in-feed and AI engagement | Impressions + dwell time | Captures visibility & attention |
| Bounce rate | Misleads for single-page or no-click journeys | Saves, rewatches, comments | Signals depth of engagement |
| Sessions | Only tracks site visits | In-platform engagement rate | Reflects content consumed in-platform |
| Site form conversions | Requires redirect | Native form completions | Captures frictionless conversions |
| Backlinks | Still useful but less central | AI citations & brand mentions | Build trust in AI ecosystems |
If your content lives inside platforms, so should your measurement.
The goal isn’t just traffic, it’s total visibility, influence, and conversion where the user already is.
How to Track Zero‑Click Metrics Effectively Across Channels
Learn how to monitor performance when there’s no click to follow
Zero-click content isn’t trackable through the usual paths. There’s no URL in the CTA, no UTM parameters, and often no traffic spike to chase.
But that doesn’t mean it’s immeasurable.
The key: build a multi-source workflow that merges native analytics, AI citation tracking, and CRM insight, then align everything around your funnel, not just your platforms.
Combine Native Platform Data with Owned Channel Insights
Start by tapping what each platform already gives you.
Every major platform now offers robust post-level analytics, if you know where to look:
- LinkedIn: Impressions, dwell time (via average engagement), video views, link clicks, follower growth
- X (Twitter): Thread-level impressions, engagements, profile clicks, retweets, bookmarks
- TikTok: Video watch time, replays, saves, shares, follower increases
- Instagram: Carousel swipes, Reels completions, saves, replies, profile visits
- Facebook: Post reach, reactions, comments, group engagement, native video watch rates
- YouTube (Shorts): Watch duration, click-through on in-stream CTAs, form extensions
Supplement these with:
- GA4: Brand search traffic, direct (dark) visits, time-to-convert
- CRM data: Form completions, source attribution, self-reported data (‘How did you hear about us?’)
Tip: Attribution rarely comes from one source. Look at behavior across touchpoints to tell the real story.
Track AI Mentions and Citations
Visibility now happens inside AI-generated answers.
AI platforms like ChatGPT, Perplexity, Google SGE, and Claude regularly cite branded content, but most marketers don’t track this.
Here’s how:
- Perplexity: View citation patterns on your domain by querying core terms and topics. Look for recurrence.
- ChatGPT (via Browse or Plugins): Manually test prompts to see if your brand, name, or domain shows up in responses or citations.
- Google Overviews: Search branded queries or industry questions to see if your content is referenced in AI-generated summaries.
- Tools: Brandlight.ai, Mention, or SEO tools like Ahrefs (to find non-link brand mentions)
GEO tip: Track not just links, but mentions and contextual citations in AI summaries.
Build a Dashboard That Reflects Funnel Flow
Organize metrics by intent, not channel.
Traditional dashboards split performance by channel (e.g., LinkedIn vs. Instagram). That doesn’t reflect a zero-click funnel.
Instead, structure reporting around stages:
Awareness Layer (Top-of-Funnel)
- Platform impressions
- AI citation frequency
- Follower growth
- Branded search query volume
Engagement Layer (Mid-Funnel)
- Engagement rate
- Saves, shares, rewatches
- Profile visits
- Comment volume + thread depth
Conversion Layer (Bottom-Funnel)
- Native lead-gen completions
- Instant page clicks or opt-ins
- Tap-to-DM or profile click-through
- CRM pipeline from native forms
Bonus: Track time-to-convert and exposure frequency to understand how long your zero-click journey takes.
Tools for a Complete Zero‑Click Tracking Stack
| Function | Tool Example | Why It Works for Zero‑Click |
|---|---|---|
| Native Platform Metrics | LinkedIn Analytics, TikTok Pro | Measures post-level visibility and engagement |
| AI Citation Monitoring | Perplexity AI, Brandlight.ai | Identifies where your brand is referenced without links |
| Web Behavior/Attribution | GA4, Plausible, Fathom Analytics | Tracks direct, branded, and post-click behaviors |
| Self-Reported Attribution | CRM fields, Typeform, Survicate | Captures influence that doesn’t show up in analytics |
| Dashboard Consolidation | Google Looker Studio, Databox | Aligns metrics from multiple sources into funnel view |
What Benchmarks Define Zero‑Click Content Success?
How to know if your zero-click content is actually working.
Without clicks, you need new thresholds to gauge performance. These benchmarks help you set expectations and spot when something’s actually gaining traction.
Engagement Rate Ranges
Solid engagement means relevance, not just reach.
- LinkedIn: 2–6% is strong. Over 6% = viral tier.
- Instagram: 1–4% for Reels, 4–6% for carousels.
- Twitter/X: 1–3% engagement across thread views.
- TikTok: Completion rate over 50% = good. Over 70% = algorithm bait.
Video Dwell & Watch Time
Time-on-content is one of the strongest signals across platforms.
- TikTok: 30s+ full watches. Repeat views = ranking fuel.
- Reels: Aim for 15–30s watch completions.
- YouTube Shorts: 40–60% average view duration = solid. Higher = rocket fuel.
Branded Search Uplift
Search spikes show your message is sticking, even without links.
- Track keyword growth using Search Console.
- 15–25% month-over-month increase after a campaign = success.
AI Citation Growth
Appearing more in AI answers means rising brand authority.
- If Perplexity starts citing your brand 2–3× per week, you’re in the loop.
- Track branded citations in tools like ChatGPT Browse and Google AI Overviews manually or via tools.
Funnel Velocity Signals
- Time from first touch to lead: 7–21 days is strong for B2B.
- 2–3 exposures before opt-in = effective zero-click sequencing.
Common Mistakes When Tracking Zero‑Click Content
What most marketers get wrong about measuring zero-click visibility.
Zero-click content is easy to misread if you’re still thinking like it’s 2020. Here’s where most people go off-track.
Mistaking Impressions for Impact
Big reach doesn’t mean real influence. You need engagement, dwell, and branded recall.
Vanity reach = low ROI unless paired with quality signals.
Ignoring Engagement Quality
Likes are cheap. Saves, comments, replays, bookmarks? Those are the signals algorithms, and humans, care about.
Track depth, not just volume.
No Self‑Reported Attribution
Zero-click flows require asking people where they came from.
If you don’t collect ‘How did you hear about us?’ in forms or calls, you’ll miss the biggest influence channel.
Underestimating Dark Social and Passive Visibility
Your best posts often get shared in Slack, WhatsApp, and email threads, where there’s no referral data.
AI surfaces your content too, but won’t send traffic.
Without a system to track or spot this, you’ll assume content flopped when it’s actually everywhere.
Best Practices for Zero‑Click KPIs
How to operationalize measurement in a platform-first world.
Measuring zero-click success isn’t just about swapping out metrics, it’s about building a reporting model that reflects how attention and influence work.
Map KPIs to the Funnel
Start by aligning measurement with each stage of your zero-click funnel:
- Awareness: Impressions, AI citations, branded search lift
- Consideration: Saves, comments, dwell time
- Conversion: Lead-gen form fills, Instant Page interactions, tap-to-chat starts
Tracking by funnel stage reveals what’s actually moving people forward, even if they never leave the platform.
Monitor AI Citations Consistently
Set up recurring checks across:
- ChatGPT (via Browse/Custom GPTs)
- Perplexity.ai
- Google’s AI Overviews
Name consistency matters. If your brand or authors aren’t standardized, citations won’t be counted, or noticed by users.
Isolate Dark Traffic with Smart Link Use
Use UTM parameters in profile bios, DM links, and community shares to tag zero-click referrals without disrupting the post’s reach.
Track what lands in ‘Direct / None’ traffic in GA4 to reverse-engineer content that’s quietly driving action.
Shift to VOI (Value on Investment)
Traditional ROI tracks revenue per channel. But zero-click isn’t always about direct conversion, it’s about influence.
Report on:
- Brand visibility growth
- Engagement-to-conversion lag time
- Content-assisted conversions
This gives a fuller picture of what content is working, even if it didn’t drive the click.
Why Smart Marketers Measure Beyond Clicks
Attention is the asset. Clicks are optional.
In 2025, visibility isn’t always traceable. AI assistants summarize your content. Social feeds deliver your ideas. Your influence spreads, but doesn’t always register as a session in GA4.
That’s not a failure. It’s the new funnel.
Brands that evolve their metrics, focusing on dwell, shares, citations, and zero-click conversions, will outpace those still measuring like it’s 2015.
Measure what matters now: visibility, trust, relevance, and action, with or without the click.
FAQ: Zero‑Click Metrics
A zero-click metric is any measurable signal that shows your content is performing without generating a click to your website. That includes impressions, engagement rate, AI citations, social saves, branded search volume, or lead-gen form completions that happen entirely inside a platform.
You can track AI citations by regularly prompting tools like ChatGPT or Perplexity with your brand keywords or topic terms to check for referenced content. For Google Overviews, monitor whether your content appears in the sources linked below summaries. Name consistency, structured content, and topical authority all increase the likelihood of being cited.
Funnel velocity measures how quickly a user goes from first exposure, such as seeing a social post or AI-surfaced summary, to taking a measurable action, like filling out a lead form or starting a trial. In zero-click funnels, it reflects momentum, not just end-point conversions.
Success on LinkedIn is measured through a combination of native visibility and engagement signals. Look at total impressions, dwell time, save rate, and comment depth on posts. Track follower growth and monitor lead form completions from LinkedIn-native ads. Self-reported attribution (e.g., ‘I saw your post on LinkedIn’) is another key input.
Use Google Search Console to monitor increases in branded query impressions. For AI visibility, tools like SparkToro and keyword monitoring tools can help identify when your brand is cited or associated with key topics. Social analytics platforms (LinkedIn, X, TikTok) show reach and engagement at the post level, even without outbound traffic.
ROI (Return on Investment) focuses on immediate returns, typically conversions or revenue tied to spend. VOI (Value on Investment) expands the lens to include visibility, engagement, authority, and long-term brand equity. VOI is critical for measuring zero-click performance where results are often delayed or non-linear.
Track impressions, video views, saves, and meaningful engagement inside each platform. Monitor comment sentiment, follower growth, and group joins. Use link tracking in bios or comments where available. For deeper attribution, combine platform analytics with CRM tagging and self-reported source questions in forms or surveys.